Benchmarking Eco Cleaners by Carbon, Water, and Toxicity: A How-To
Benchmarking Eco Cleaners by Carbon, Water, and Toxicity: A How-To
Eco-friendly cleaning choices shouldn’t be guesswork. If you’re asking how to compare lifecycle analysis data between eco cleaners, the answer is to ground every comparison in three pillars—carbon, water, and toxicity—using recognized standards, per-use functional units, and transparent assumptions. This guide shows you how to set scope, choose frameworks and software, collect the right data, model product carbon and water footprints, screen ingredient toxicity and biodegradability, and translate results into per-use benchmarks a buyer can trust. The workflow mirrors the core phases of lifecycle assessment (goal and scope, inventory, impact assessment, and interpretation) and aligns with certification criteria used in the cleaning sector. You’ll also see how to validate environmental gains with real cleaning performance, factor in concentrates and low‑waste refills, and communicate claims without greenwashing. Cleaning Supply Review applies this workflow in our independent comparisons and shares templates you can adapt.
Why carbon, water, and toxicity are the right metrics
Lifecycle assessment is a cradle-to-grave method that evaluates environmental impacts from raw materials through manufacturing, use, and disposal to enable science-based product comparisons. It’s the backbone of many eco-cleaning certifications that consider impacts from ingredients to end-of-life, ensuring like-for-like decisions rather than marketing-based ones.
These three metrics are the baseline:
- Carbon: A product carbon footprint quantifies climate impact in CO2e across the life cycle, aligned with ISO 14067 and Scope 1–3 accounting to the GHG Protocol. This pairing is standard practice in credible PCF work and supports audit-ready claims (see ISO 14067-aligned PCF guidance from Carbon Maps).
- Water: Water footprinting should distinguish blue, green, and grey water and include water-quality effects. Methods developed by the Water Footprint Network and ISO-aligned approaches are widely used, and many PCF/LCA tools implement them alongside GHG accounting (overviewed in GHG Protocol-aligned tools by Manglai).
- Toxicity: Ingredient screening against EPA Safer Choice/Design for the Environment criteria highlights products made with safer ingredients and lower human and aquatic hazard; this is central to ecolabel credibility (EPA Safer Choice criteria).
Together, these indicators cover product carbon footprint, water footprint, ingredient toxicity, aquatic toxicity, and biodegradability—terms buyers increasingly expect to see mapped to recognized ecolabel criteria.
Define scope and system boundaries
Make comparisons apples-to-apples by fixing two things up front: a functional unit and a clear system boundary.
- Recommended functional unit: per standard cleaning use—e.g., 5 ml diluted in a 500 ml trigger sprayer or a measured dose per mop bucket. For supplier negotiations or bulk procurement, keep per liter data as a secondary view.
| Functional unit | When to use | Pros | Cons |
|---|---|---|---|
| Per use (primary) | Household/pro use decisions; cross-brand benchmarking | Reflects real tasks; normalizes dosing | Requires clear dose assumptions |
| Per liter | Procurement and supplier assessments | Simple to source/quote | Ignores dilution and overuse risk |
| Per m² cleaned | Floor care and facilities | Links to outcomes (area cleaned) | Needs standardized test protocols |
- Boundaries: Use cradle-to-grave (raw materials → manufacturing → packaging → transport → use → end-of-life). State explicitly that Scope 1–3 emissions are included for carbon. System boundary defines which life‑cycle stages, processes, and flows are counted in an LCA or PCF so results are complete and comparable across products.
Select recognized frameworks and standards
Choose frameworks that withstand scrutiny and reduce greenwashing risk, and map each to a metric:
- Carbon: ISO 14067 for PCF quantification; GHG Protocol for Scope 1–3 accounting (ISO 14067-aligned PCF guidance).
- Water: Water Footprint Network and ISO-aligned methods for blue, green, and grey water (as commonly incorporated in GHG Protocol-aligned tools).
- Toxicity: EPA Safer Choice and DfE identify cleaning products with safer ingredients; Cradle to Cradle adds material health and water stewardship to a broader sustainability lens (EPA Safer Choice criteria).
For indicators and dashboards, ISO 14031 performance evaluation and Cleaner Technology Performance Indicators (CTPI) offer structures to define KPIs and benchmarking scorecards (EPA Ireland on environmental KPIs).
Definition: Product Carbon Footprint (PCF) focuses on CO2e emissions across a product’s life cycle, while LCA can include a broader suite of indicators—often 16 or more—such as water use and toxicity to enable fuller comparisons (ISO 14067-aligned PCF guidance). In our reviews, Cleaning Supply Review maps these standards to per‑use KPIs to make cross-brand comparisons practical.
Choose software and data sources
Select tools that are audit-ready, interoperable, and practical for cleaning product datasets.
- Look for LCA/PCF software aligned with ISO 14064/14067 and GHG Protocol, with ERP integrations for data automation and traceable outputs suitable for assurance (GHG Protocol-aligned tools).
- For disclosure and target-setting, ESG platforms that support GRI, SASB, TCFD, and CSRD help connect product footprints with enterprise goals and science-based pathways (ESG platforms overview).
- Benchmarking utilities, including sectoral emissions benchmarking tools, can add transparency at asset and corporate levels—useful when vetting chemical and packaging suppliers (emissions benchmarking tools).
Key terms: PCF software, LCA database, emissions factors, ESG reporting, data automation. Cleaning Supply Review maintains a concise buyer’s checklist for ISO/GHG‑aligned LCA and PCF tools used in cleaning product assessments.
Collect primary data for cleaners and packaging
Gather a minimum viable dataset to model cleaners accurately (including concentrates, dilutions, and refills):
- Formulation: ingredient list and mass fractions; surfactant classes (anionic, nonionic, amphoteric); fragrance/solvent content; biodegradability data (e.g., OECD test results).
- Operations: supplier energy and process data; manufacturing yields; transport modes and distances from key nodes; warehouse energy; dilution ratios and dose per use; in-use water temperature.
- Packaging: material types and weights (bottle, trigger, cap, label, corrugate); refill formats (pouches, tablets, bulk jugs); end-of-life assumptions (recyclability rates, take-back, reuse).
- Safety and hazard: capture eye/skin/respiratory irritation classifications early—especially for concentrates—and any aquatic hazard flags (EPA Safer Choice criteria).
- Data gaps: where primary data is missing, use vetted secondary emission factors and document every assumption in an audit trail (GHG Protocol-aligned tools).
Cleaning Supply Review’s data capture templates mirror these fields to speed supplier requests.
Model carbon and water footprints
Turn data into per-use metrics with traceability:
- Run a PCF for each product in ISO 14067-compliant software and include Scope 1–3 where material (ISO 14067-aligned PCF guidance).
- Model blue/green/grey water using WFN/ISO methods; report both withdrawals/consumption and water-quality impacts where available (GHG Protocol-aligned tools).
- Output per-use results (e.g., gCO2e/use; liters/use) and keep per liter for procurement.
Definition: Blue water is surface and groundwater used; green water is rainwater stored in soil and taken up by plants; grey water is the volume needed to dilute pollutants to meet quality standards (GHG Protocol-aligned tools).
Run sensitivity analyses to find hot spots: energy-intensive ingredients, triggers or steel components in packaging, and paper or glass. For supplier context, blast furnace–basic oxygen furnace steel emits about 2.0–2.2 tCO2 per tonne and produces roughly 70% of global steel—useful when discussing metal packaging tradeoffs (industrial emissions context).
Screen ingredient toxicity and biodegradability
Evaluate human and aquatic hazard, and ensure chemistries are designed to break down safely—without sacrificing cleaning efficacy.
- Toxicity screening: review authoritative hazard lists; check acute/chronic aquatic toxicity; assess skin/eye/respiratory irritation; confirm biodegradability. Align with Safer Choice/DfE criteria and consider Cradle to Cradle material health requirements for higher ambition (EPA Safer Choice criteria).
- Science matters: surfactants in detergents can drive aquatic toxicity and shift pH, with documented impacts on marine organisms—make explicit aquatic toxicity endpoints part of the benchmark (surfactants and environmental impact).
- Definition: Biodegradability is the capacity of ingredients to be broken down by microbes into CO2 and water; simplification of chemistries often improves microbial decomposition (surfactants and environmental impact).
Secondary terms to include in documentation: human health hazard, aquatic toxicity, OECD tests, biodegradation, ingredient transparency.
Normalize results and create benchmarks per use
Make results comparable and easy to interpret.
- Convert all outcomes to per-use units with clear dosing assumptions (gCO2e/use, L water/use, toxicity tier/use). Keep a single “recommended dose” for head-to-heads and list any alternative dose scenarios.
- Normalize by m² for floor care and by soil class for degreasers when relevant. Keep per liter data in an appendix.
Example per-use table (identical 5 ml use in 500 ml sprayer):
| Cleaner | gCO2e/use | L water/use | Toxicity tier (Safer Choice-aligned) | Cost/use |
|---|---|---|---|---|
| Brand A (concentrate) | 24 | 0.38 | Preferred | $0.11 |
| Brand B (RTU) | 41 | 0.47 | Acceptable | $0.22 |
| Brand C (refill tablet) | 19 | 0.35 | Preferred | $0.09 |
Indicators to standardize: PCF (ISO 14067), blue/green/grey water, and toxicity tiers aligned with Safer Choice ingredient lists. This per‑use scorecard format matches how Cleaning Supply Review presents benchmarks in product reviews.
Interpret tradeoffs and validate with performance testing
Contextualize results and confirm that lower-impact formulas still clean effectively.
- Common tradeoffs:
- Lower-toxicity formulations may need a higher dose or contact time, increasing water or carbon per task.
- Concentrates and refill systems reduce packaging mass and transport emissions but raise irritation risk and can inflate per-use footprints if users over-dose.
- Pair LCA outcomes with lab-style and at-home tests (e.g., soil removal from glass/steel, residue/streaking, contact time). Comparative LCAs are especially important when evaluating bio-based detergents versus petrochemical baselines (surfactants and environmental impact).
- Two-cleaner strategy: for homes and facilities, use a low-toxicity, Safer Choice-aligned daily cleaner for most tasks, and reserve a List N–registered disinfectant (or NEA-registered equivalent) for illness spikes and high-touch disinfection. Track cost-per-use to ensure sustainability gains don’t outpace budgets.
- Wastewater awareness: high organic loads elevate treatment needs; use COD/BOD context when discussing industrial cleaning effluent (industrial emissions context).
Report transparently and pursue credible certifications
Reduce greenwashing risk with verifiable reporting and third-party review.
- Produce audit-ready reports aligned to ISO/GHG protocols with traceable data sources, methods, and assumptions. Version-control any updates and keep data dictionaries for reviewers (GHG Protocol-aligned tools).
- Pursue credible ecolabels: Safer Choice/DfE for safer ingredients; Cradle to Cradle for material health, water stewardship, energy, and social fairness. Reputable eco-cleaning certifications require performance, safety, and environmental testing before approval (EPA Safer Choice criteria).
- Avoid vague claims like “eco safe.” Pair claims with metrics, methods, time period, and data provenance to maintain credibility (EPA guidance on green claims).
Cleaning Supply Review weighs transparency and third‑party review when evaluating claims.
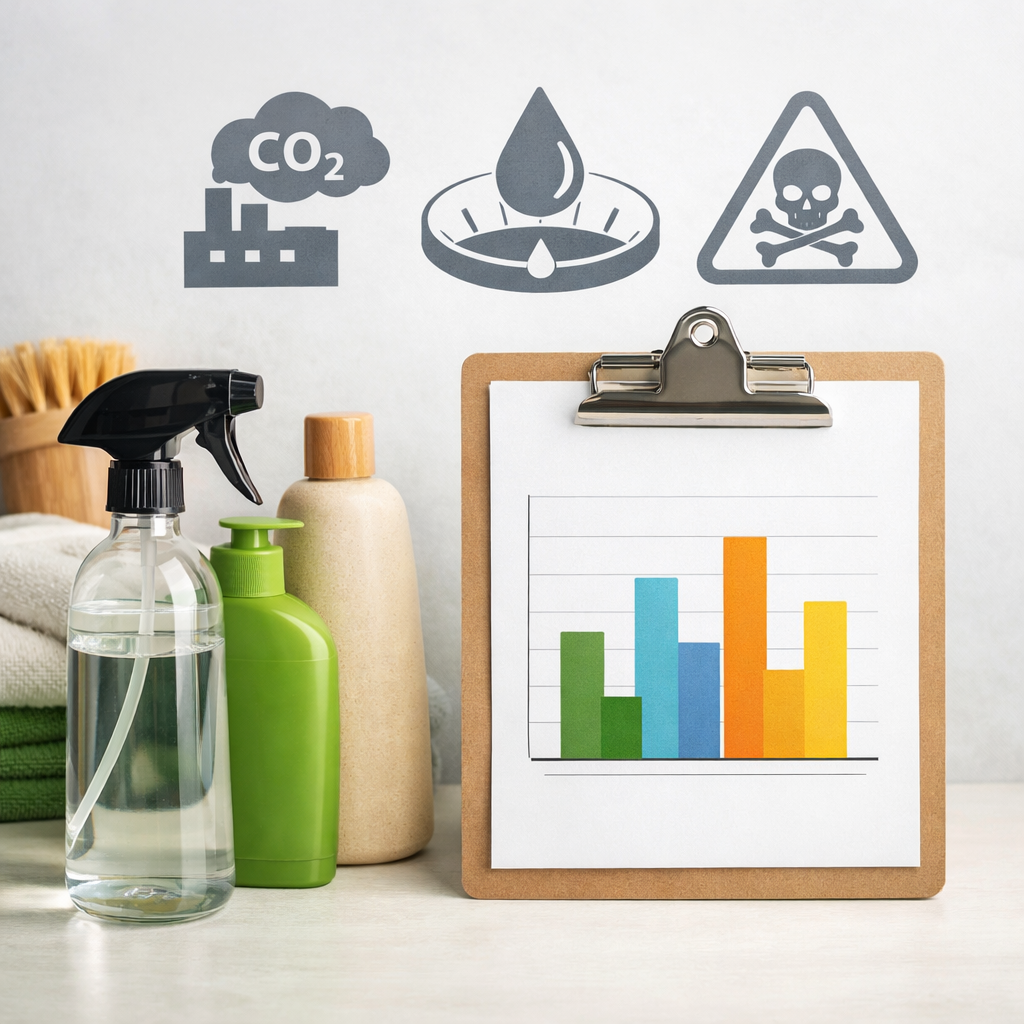
Visualize and communicate results to avoid greenwashing
Present findings clearly, consistently, and with discipline.
- Use simple visuals and tables:
- Per-use bar charts for gCO2e/use and L water/use.
- A toxicity matrix by ingredient class with Safer Choice alignment tiers.
- A one-page scorecard summarizing PCF, water, toxicity, packaging scenario, refill option, and cost-per-use.
- Add atomic paragraphs and quotable definitions (e.g., PCF; blue/green/grey water) to support snippet capture and quick comprehension.
- Claims discipline: pair every claim with a metric (ISO 14067, WFN/ISO), method note, time boundary, and source link; include a short “Methods” box in PDFs and pages. EPA cautions that vague environmental claims are misleading; anchor communications in verifiable criteria (EPA guidance on green claims).
Frequently asked questions
What is the best functional unit for comparing cleaners?
Use per-use as the primary functional unit (e.g., grams CO2e and liters water per recommended dose) because it reflects real cleaning tasks and normalizes dosing; for floor care, add per m². Cleaning Supply Review uses this per‑use default across our comparisons.
How do I handle missing supplier or ingredient data?
Use recognized secondary emission factors and clearly document assumptions, then update with primary data when available. Cleaning Supply Review recommends ISO/GHG-aligned tools that produce audit-ready reports so gaps and revisions stay traceable.
Do concentrates and refill systems always reduce footprint?
Usually they cut packaging and transport impacts, but benefits depend on dosing accuracy and user behavior. Cleaning Supply Review flags cases where higher dose or overuse raises the per‑use footprint.
Which toxicity criteria align with Safer Choice or similar ecolabels?
Screen for safer ingredients, low aquatic toxicity, biodegradability, and minimized skin/eye/respiratory irritation; align with Safer Choice/DfE and consider Cradle to Cradle’s material health and water stewardship. Cleaning Supply Review’s benchmarks follow these endpoints.
How do I compare products fairly across different surfaces and soils?
Standardize soil types and surfaces in testing, then report per-use results alongside per m² or per task metrics. Cleaning Supply Review keeps dilution, contact time, and test protocols consistent so comparisons are apples-to-apples.